
Food cost percentage is the share of your food sales that you spent on the food itself. You can calculate it two ways: for the whole kitchen over a period, from inventory and purchases, or for one dish, from its recipe. The first tells you how the business did. The second tells you what to charge.
This guide covers both, then costs a cheeseburger line by line using September 2026 US average prices from the Bureau of Labor Statistics and a cooking yield from the USDA, and shows the menu price at 25%, 30% and 35% food cost.
Food cost percentage for a period
For a week or a month, food cost is what you actually used up, which is not the same as what you bought. Inventory at the start and end of the period corrects for that:
Food cost = beginning inventory + purchases − ending inventory
Food cost percentage = food cost ÷ food sales × 100
Example for one month
| Line | Amount |
|---|---|
| Beginning food inventory (1 September) | $8,000 |
| + Food purchases in September | $22,000 |
| − Ending food inventory (30 September) | $7,500 |
| = Food cost | $22,500 |
| Food sales in September | $72,000 |
| Food cost percentage | $22,500 ÷ $72,000 = 31.3% |
These are illustrative numbers for a fictional restaurant. A few rules make the result meaningful:
- Count inventory the same way, at the same time of day, each period.
- Keep beverages separate from food if you sell alcohol; pour cost behaves differently.
- Use sales before sales tax, and decide once whether staff meals and comps come out of food cost or are tracked separately.
Food cost percentage for one dish
For a single menu item, the cost side is the plate cost: the cost of every ingredient in one portion.
Dish food cost % = plate cost ÷ menu price × 100
Turn it around and you get a menu price from a target:
Menu price = plate cost ÷ target food cost %
The period number will usually come out higher than the average of your dish numbers, because of waste, spoilage, over-portioning, comps and theft. The gap between the two is one of the most useful things a kitchen can track.
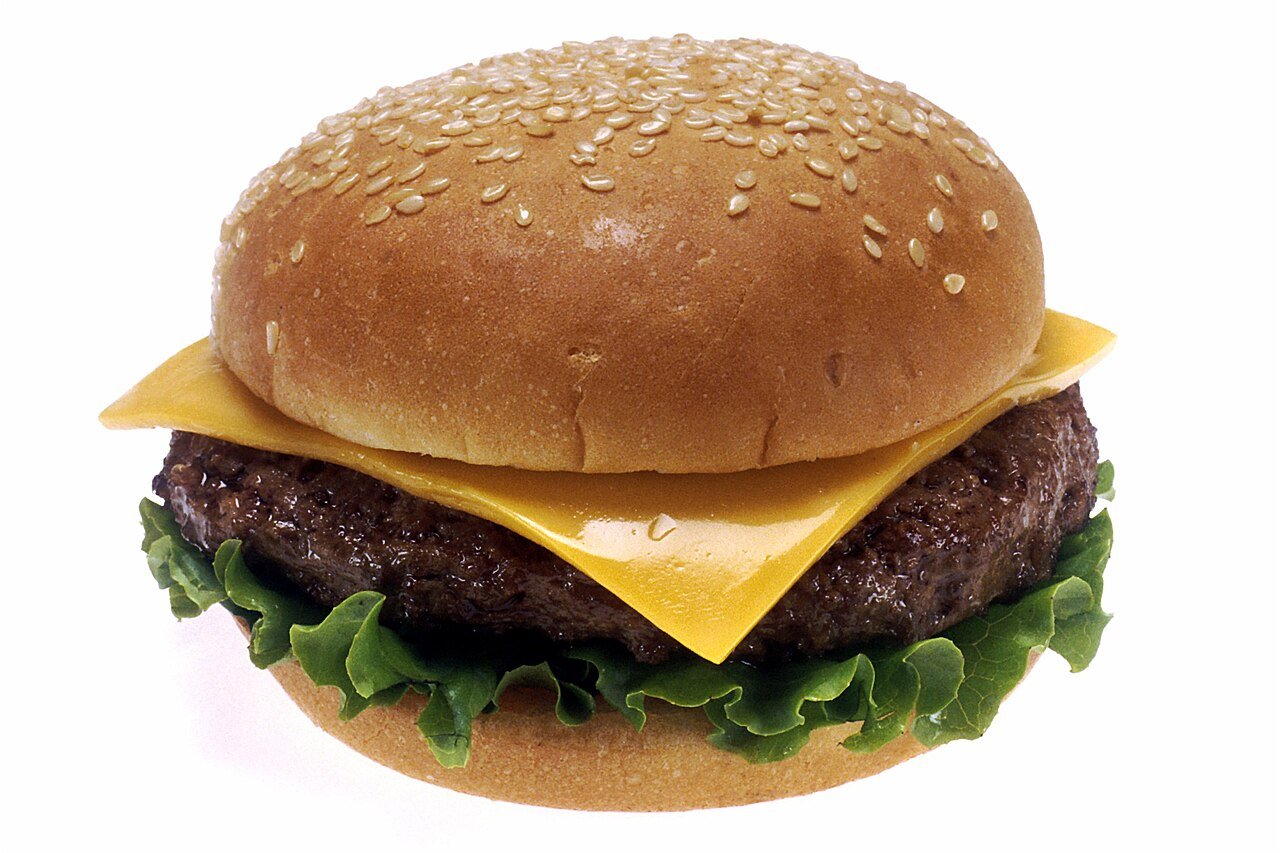
Worked example: what a cheeseburger costs to make
Prices below are US city averages for September 2026 from the BLS Average Price Data (BLS average prices). These are retail prices. A restaurant buying from a distributor will usually pay different prices, so treat this as a method, not as what your plate will cost. Put your own invoice prices in each line.
| Ingredient | Portion | Price, Sep 2026 (source) | Cost |
|---|---|---|---|
| Ground beef, 100% beef | ¼ lb raw (4 oz) | $6.792/lb (BLS) | $1.70 |
| Cheddar cheese | ¾ oz slice | $6.133/lb (BLS) | $0.29 |
| Bun | 2 oz | $1.830/lb, white pan bread as a proxy (BLS) | $0.23 |
| Iceberg lettuce | ½ oz | $1.636/lb (BLS) | $0.05 |
| Tomato | 1 oz | $1.992/lb (BLS) | $0.12 |
| Onion, pickles, sauce | small amounts | not costed here (our assumption) | $0.15 |
| Plate cost | $2.54 | ||
The beef is two-thirds of the plate cost ($1.70 of $2.54). Cheese and bun together are about a fifth. Lettuce and tomato barely register. That pattern is typical: in most dishes, one or two lines drive the cost, and they are the ones to watch when prices move.
Menu price at 25%, 30% and 35% food cost
Dividing the $2.54 plate cost by each target gives:
| Target food cost % | Calculation | Menu price before tax |
|---|---|---|
| 25% | $2.54 ÷ 0.25 | $10.16 |
| 30% | $2.54 ÷ 0.30 | $8.47 |
| 35% | $2.54 ÷ 0.35 | $7.26 |
Most kitchens then round to a price ending they like ($8.50, $8.95) and check the result against what nearby restaurants charge. The target you choose depends on your concept, labor and rent; there is no single correct percentage. What matters is to pick one deliberately and see which dishes sit above it.
Side dishes count too. If the burger comes with fries, cost the fries portion and add it to the plate cost before you divide.
Yield traps that hide cost
The cheeseburger above is costed from the raw weight. That is correct for purchasing, but it hides the biggest trap in costing: yield, the share of what you buy that ends up on the plate.
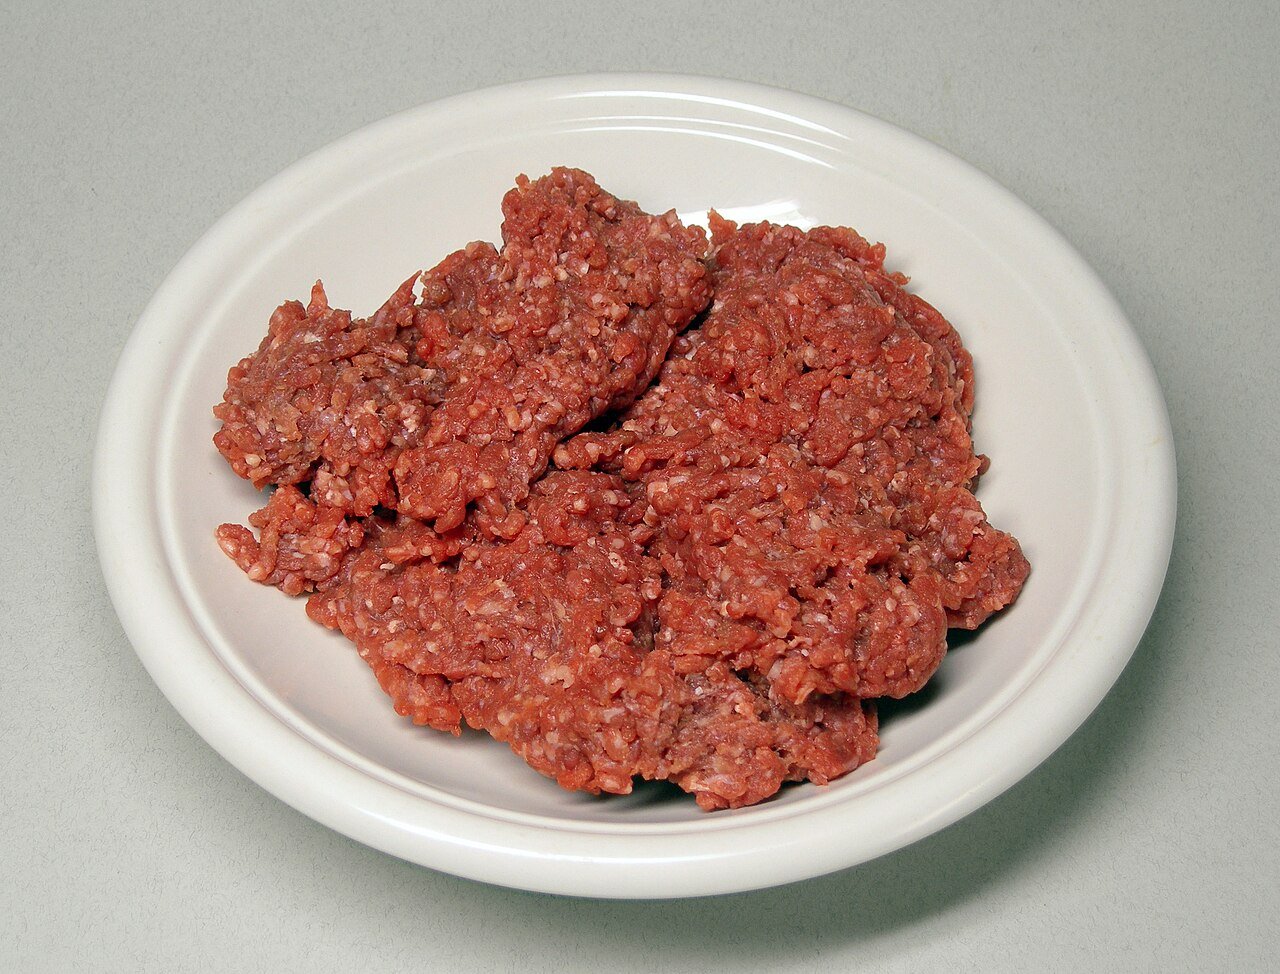
Cooking loss on the patty
The USDA Food Buying Guide, used for school meal programs, states that “1 lb of fresh or frozen ground beef, no more than 15% fat as purchased, provides 0.75 lb of cooked, drained lean meat” (USDA FNS Food Buying Guide, Appendix B). Fattier blends lose more.
Applied to the burger:
- A ¼ lb (4 oz) raw patty cooks down to about 3 oz at that yield.
- If your menu promises a 4 oz cooked patty, you need 4 ÷ 0.75 = 5.33 oz raw (0.333 lb), which costs 0.333 × $6.792 = $2.26.
- The plate cost rises from $2.54 to $3.10, and the price at 30% food cost rises from $8.47 to $10.33.
Costing a dish by its cooked weight but buying by raw weight, without the yield step, is one of the quickest ways to under-price a menu.
Trim on produce
The same logic applies to trim. If you discard outer leaves and the core of a head of lettuce, you are paying for weight you never serve. The usable cost is:
Cost per usable lb = price per lb as purchased ÷ yield
Weigh a few heads before and after trimming to get your own yield, or use the USDA Food Buying Guide figure where it lists one, and use the usable cost in the recipe.
Portion drift
A ¾ oz cheese slice that becomes a 1 oz slice on a busy night adds about $0.10 per burger at these prices. Across a few hundred burgers a week, it shows up in the period food cost even though the recipe card has not changed.
Percentage versus dollars per plate
Food cost percentage is a ratio, and a low ratio is not always the most profitable dish. Compare two illustrative items:
| Dish | Plate cost | Menu price | Food cost % | Dollars left per plate |
|---|---|---|---|---|
| Cheeseburger | $2.54 | $8.50 | 29.9% | $5.96 |
| Steak plate (illustrative) | $10.50 | $28.00 | 37.5% | $17.50 |
The steak runs a worse percentage but leaves almost three times as many dollars per plate to pay labor and rent. Use the percentage to spot dishes that drift over your target, and the dollar margin to decide which dishes to feature. Both come from the same plate cost, which is why getting that number right matters.
Keeping the numbers current
A plate cost is only as good as the prices in it. In this example, a 10% rise in ground beef adds about $0.17 to the plate cost and moves the burger’s food cost at an $8.50 menu price from 29.9% to 31.9%. A few habits keep that visible:
- Update the price of your top cost drivers (proteins, cheese, oil) every time a new invoice arrives.
- Re-cost every dish that uses an ingredient when its price changes, including sub-recipes such as sauces and doughs.
- Compare the period food cost percentage with your recipe-based expectation each month, and investigate a gap of more than a point or two.
FAQ: food cost percentage
What is the formula for food cost percentage?
For a period: (beginning inventory + purchases − ending inventory) ÷ food sales × 100. For a dish: plate cost ÷ menu price × 100.
Should I use the menu price with or without sales tax?
Without. Sales tax is collected for the state, not earned by the restaurant, so use pre-tax prices and pre-tax sales.
Why is my monthly food cost higher than my recipe costs suggest?
Waste, spoilage, over-portioning, comps, staff meals and theft all add cost that recipe cards do not show. Track the gap between the two numbers over time.
Do I cost the patty by raw or cooked weight?
Cost what you buy, which is raw weight, and use a yield to convert to the cooked portion you serve. USDA lists 0.75 lb cooked, drained lean meat per pound of ground beef with no more than 15% fat.
How often should I re-cost my menu?
Whenever a major ingredient’s invoice price changes, and in full at least each time you reprint the menu.
Cost your own dishes
The arithmetic is simple; keeping hundreds of prices and recipes current is the hard part. Platemise is building a recipe and menu costing workspace for independent restaurants and caterers that re-costs dishes from your own prices and yields. Read how we cost our sample dishes, browse more costing guides, or suggest a dish for us to cost next.
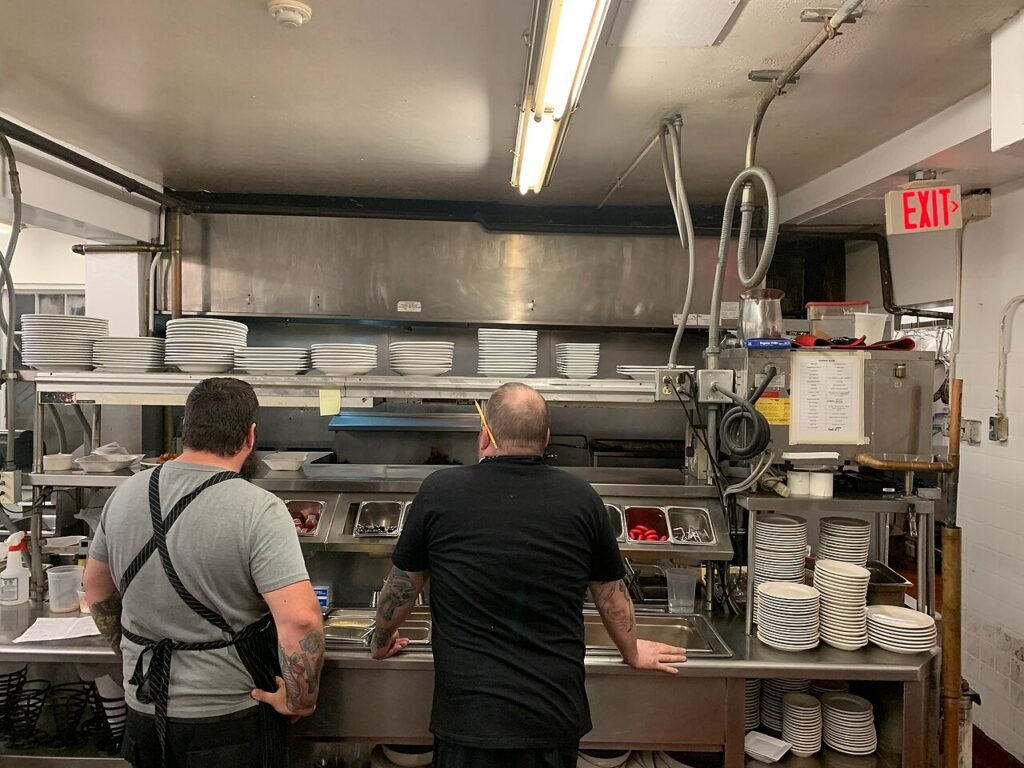
Featured image: a restaurant kitchen’s expo station. Photo: MarkBuckawicki / Wikimedia Commons, CC0. Prices: BLS Average Price Data, US city average, September 2026. Yield: USDA FNS Food Buying Guide. Sample figures are illustrations, not what you will pay. Last checked 29 October 2026.
